The county council gave the second of three required approvals to a tax ordinance which noted that the company anticipated “investing approximately $70 million in new machinery and equipment” and could have 360 employees within five years, the paper said.
Colleton County Economic Development Director Heyward Horton said that, if the project is completed, it would be the county’s biggest-ever economic development project.
Colleton is a county of about 40,000 people located adjacent to Charleston County in the Lowcountry area of South Carolina.
Dynamic Brands is set to invest $3.8 million and create 12 jobs at a 65,000 square foot facility in Pageland, the paper reports. Dynamic is the parent company of several brands of golf carts, walking bags, golf towels and other recreational and travel accessories.
The growth is due not only to FedEx’s continuing business there, but also Boeing and its manufacturing center.
“Boeing has brought significant shipments to the area,” FedEx cargo terminal operations manager Mike Matricciano told the paper. “Volvo probably will, too. With all the manufacturing moving here, we are anticipating additional growth.”
And American Airlines spokeswoman Whitney Zastrow said
“Charleston International Airport has become an increasingly popular destination, thanks to the state’s growing automotive industry.”
Swiss-based biopharma company Lonza will invest $46 million over five years in its Greenwood County plant, creating 30 new jobs, the state of South Carolina announced.
The company’s expansion includes nearly 50,000 square feet of new manufacturing space.
At the beginning of 2017, Agoria’s Ward Vleegen had a short time to make a big impact for his Belgian automotive group.
By mid-2018, he had.
As head of the newly created Transport and Mobility Group, Vleegen was charged with building a new division within the much larger AGORIA group – Belgium’s largest employer and trade association.
Ward Vleegen, head of Agoria’s Transport and Mobility Club in Belgium
Vleegen knew what he was doing – he’d been creating collaborations within the automotive industry for more than a decade. And his board and members were serious about building business – not simply joining another network.
The prospect of a U.S. trip was discussed almost from the time the group began in November of 2016.
Focused Approach
“My steering committee asked for a very focused approach, and not just a general visit,” Vleegen said.
About the same time, the Upstate SC Alliance, home to BMW’s largest manufacturing and plant as well as the North American headquarters of Michelin, asked SC Connect to help it make inroads into Belgium.
SC Connect reached out to Vleegen and his group. Cautious at first, Vleegen over time warmed to the idea and helped arrange a meeting with members of his group and the Upstate Alliance during the Alliance’s Belgian visit in June, 2017.
Once that happened, “We could see that the (Belgian) companies that were present were interested in South Carolina,” Vleegen said. “And that, for us, meant ‘okay, we have to move this forward.”
Driving Ahead
Through the summer of 2017, Vleegen, the Upstate SC Alliance, and SC Connect worked to connect the Transport and Mobility Club to the South Carolina automotive sector. The Belgian Consul General‘s office got involved, as well as the SC Department of Commerce and the SC Automotive Council.
As a result, Vleegen led a delegation of nine companies to the 2018 SC Automotive Summit, where they gave an afternoon presentation to some 500 attendees. SC Connect arranged meetings with key automotive industry players, including BMW, Sage Automotive, Draexlmaier and others.
The result: BMW has asked at least five of Vleegen’s members to connect with executives, and conversations with other partners continue.
“I think for me, personally, the meeting with BMW was really, really good. Because it gave insight that you cannot find on the internet—what are the technology needs of BMW,” he said.
Boots on the Ground
Vleegen knows he would have made the contacts within South Carolina sooner or later. But he credits SC Connect with speeding the process by making the personal connection.
“I think what is always essential is that we have a local partner to work with,” he said. “Working with someone like SC Connect, which has boots on the ground, was very useful.”
Belgian bus manufacturer Van Hool considered Orangeburg, SC, Fairfield County and Florence, SC as sites for the new plant recently announced for Morristown, TN.
But the company drove on due to concerns over supplying a future work force and difficulty finding the right site, the company’s in-house project consultant says.
Ultimately, Tennessee — a state not even on their original list — won the $47 million project, the company’s largest investment outside Belgium.
Tennessee Gov. Bill Haslam joined CEO Filip Van Hool April 12 to announce the project that’s expected to produce buses as early as 2021.
Project Consultant Benedicte Gruwez spoke recently at the US Embassy in Brussels, then later by telephone about the selection process for the 71-year-old company’s largest investment outside of Belgium.
Years of Planning
Van Hool began considering the US as a way to continue growing about five years ago, Gruwez said. With footholds in the private market, the company saw US growth through sales of public transport buses.
“We knew our US market. We knew that our growth was limited,” she said. “For us to grow, we needed to step into something that we were not part of yet.”
Having already sited a production facility in Macedonia, Van Hool knew the design and layout that they wanted for the new US facility. And, after attending the 2015 Select USA conference for foreign companies considering US investment, the company narrowed the search to the southeastern US – the East Coast because of its large population centers, the South because of its lower production costs.
Southeastern Opportunity
Soon, Gruwez was working with a list of five states – North Carolina, South Carolina, Florida, Virginia and Georgia.
“We have to find a place that we can produce the product and find people that can produce that quality we’re looking for,” Gruwez said. “Alabama, Tennessee and Kentucky were not initially in the first look.” But they were soon added, she said, because their experience with the automotive industry gave them skills, schooling and suppliers.
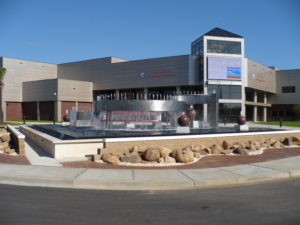
“That school just blew us away,’ she said. “The capabilities they had, the machines they had were amazing.”
Southeastern Institute of Manufacturing and Technology (SIMT) – Florence, SC
But the South Carolina sites didn’t fit Van Hool’s specifications, and the labor market seemed especially tough, Gruwez remembers, especially since the Volvo plant was opening only hours away near Charleston.
The final three states in contention were Alabama, Georgia and Tennessee.
Workforce is Destiny
In the end, she says, Tennessee “ticked all the boxes,” including right salary levels, proper site, mix of blue collar and engineering workers and general comfort level. South Carolina “fell out early,” she said, because of inappropriate sites and labor concerns.
“You need people from all ages- not only young people that just finished training” as SIMT in Florence could provide, Gruwez said. Not only was the company concerned that those newly trained at SIMT might disappear to Volvo, the company was also concerned that students still in school weren’t interested enough in manufacturing.
SC manufacturing executives told Van Hool that “people were not that much interested in manufacturing. Either they were going away or they were going into agriculture.”
The company’s big concern, she says, was “When we start up, will we find the 400-600 people we need from the beginning?”
“If you don’t have the people to do the job, it will be the problem.”
But examining the numbers behind the estimate illustrate the mystery that fuzzy statistics can really be, especially when it comes to calculating tourists. For instance,
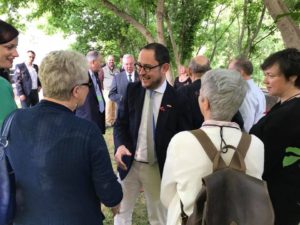
Vincent Van Quickenborne innocently raised the question during his trip to Greenville last summer. Van Quickenborne is the mayor of Kortrijk, a city in the West Flanders region of Belgium and Sister City to Greenville. He heard the number during an impressive presentation by Jennifer Stilwell of VisitGreenville.
With both cities having populations of around 70,000, Van Quickenborne was astounded that Greenville could log so many more visitors than his town.
Kortrijk Mayor Vincent Van Quickenborne during his trip to Greenville in June, 2017.
Van Quickenborne later asked SC Connect to help him understand how that number had been calculated. Van Quickenborne’s question led to the discovery of a House of Mirrors….with a hidden door… and a deep rabbit hole.
But with a little bit of legwork and a lot of their help, we came to understand this: The five million number is a tediously calculated, but very broad guess that can only be compared with other SC cities, not cities in other states or countries.
And in the end, it’s about as good a guess as anyone can get.
When is a visitor a Visitor?
As Jackson — the main estimator — told SC Connect about the five million visitor number:
“This is a ballpark number and doesn’t represent the number of visitors in 2016 or any one year. It is a ball park number of visitors for a given year in the recent past or present.” — Dudley Jackson, SC Parks, Recreation and Tourism Director of Research
SCPRT estimates 30 million visitors to South Carolina annually. That state-level number is statistically projected from a national survey which includes about 2,000 interviews with South Carolina visitors annually.
Importantly, those surveys use a very broad definition of “visitor.” It’s not just tourists or businessmen attending conventions like the recent SC Automotive Summit. A “visitor” is defined as anyone going to the region, including those
— making day trips,
— traveling through but not stopping in the city and
— staying with friends or relatives.
Bottom Line
The five million number is arrived at through legitimate means, but is in no way definitive. In addition, the number is only comparable to other cities in South Carolina, NOT cities outside the state (or country), since data collection and analysis will differ. So, the calculations giving Greenville more visitors than Orlando may each be valid — but they’re undoubtedly based on different assumptions.
So, want to know how the five million number is calculated? If so, read on…
Welcome to the House of Mirrors….
SC PRT for many years issued only one estimated number for the entire state. But a desire to use more localized numbers led SCPRT researcher Dudley Jackson a few years ago to develop his own approach. (SC Connect spoke directly to Jackson, and he is the source for the visitor estimates here.)
Today, the number issued for each county is actually a best guess based on three inputs, each the result of one of three different approaches to estimating visitors below:
Survey Data Supplied by TNS, a national research group. TNS surveys about 2,000 visitors to South Carolina annually. The total number of visitors to South Carolina annually has been around 30 million over the last several years, according to Jackson. The sample size for most individual counties is too small for estimates based on survey data alone.
Working Backwards from Accommodations Tax Collections. A 2% tax is charged to each hotel stay, which goes to the state for redistribution to communities to support tourism-related activities. Jackson uses that total per county to back into a number for hotel rooms sold, and then applies a multiplier to estimate total visitors.
Working Backwards from the number of rental units per county and occupancy rates.The number of units comes from a survey done annually by SC’s regional tourism offices. Occupancy rates come from a national research firm called STR. SC is also trying to get additional data from AirBnB.
With the three data points in hand, Jackson takes a three year average of each number, then averages that total number. He then rounds the number to get a reasonable guess that is then published. And, THAT is the five million visitor estimate that we see.
But we can tell you’re still curious.
To learn more about the three inputs, open that mysterious hidden door…
….Behind the Hidden Door…
Are you the type that just has to know the intricate details of calculation? Fine. Here’s Dudley Jackson of SCPRT to explain it all, edited for brevity and clarity:
In theory this idea is pretty simple, but in practice this is an extremely complex and labor intensive process.
To summarize the main idea, we take an average of multiple approaches to estimating visitation volume at the county level. That’s because when we need estimates for smaller and smaller geographical areas, even very large surveys often do not produce large enough sample sizes. There are also many other challenges for estimating visitation for counties towns and cities using survey data. Those include the possibility that visitors
–may not know where they are exactly, and
— may not remember day visits to towns as part of a trip to a primary vacation destination. (visiting Greenville on the way to Disney World, for example).
Our most recent estimate for annual visitor volume to Greenville County, produced in spring of 2017, was 5,000,000. This is a ballpark number and doesn’t represent the number of visitors in 2016 or any one year. It is a ball park number of visitors for a given year in the recent past or present.
This number would include visitors for leisure, business, visiting friends and relatives, medical travel, pass-through travel, evacuees from hurricanes and any other kind of travel you can imagine. It includes by day visitors and overnight visitors. We obtain our final estimate for each county by creating an in-house model that averages estimates from three different approaches, each of which have their own strengths and weaknesses:
Approach 1: The TravelsAmerica National Travel Survey by TNS
This is a survey of 35,000 United States households each month which asks them about their travel in the previous month. Two-thirds to three quarters of surveyed respondents will answer the survey and then two-thirds to three-quarters of those answering the survey will have taken a trip in the previous month. For a year, for the entire country this adds up to something in the neighborhood of 100,000 complete records each year and for South Carolina we usually get between 1,500 and 2,000 records of visitors that have taken a trip to the state in the whole year. (SC Connect emphasis). A few of our largest and most developed destinations, dominate the majority of those records. For many rural counties in South Carolina, they might get no records that report visiting them in a given year even though in reality they did get visitors. We take an average of three years of estimates to get an estimate from this approach and for counties with no sample or a small sample we basically ignore this number and just use the other two approaches
Approach 2: Work Backwards from State Level Accommodations Taxes Collected in Each County
Approach #2: A model which works backwards from state level accommodations taxes that are collected in each county
We know the amount of accommodations tax collections that are reported to our state department of revenue each year. We also know that it’s a 2% tax rate.
So, we take a three year average of collections and then we divide that mean by 2%. That gives us the corresponding amount of room revenue (sales) generated.
In order to continue working backwards towards a number of visitors, we have to have a large number of estimated multipliers. For this model, which is as close to mathematically correct as possible, we use the following multipliers:
— Estimated average daily “room” rate (3yr. avg),
— Percentage of room nights that are paid,
— Mean nights stayed by overnight visitors,
— Percentage of travel parties that are overnight, and
— Estimated household travel size.
The multipliers themselves are major source of potential error and if they are bad then your resulting estimates will be bad. (SC Connect emphasis)
We came up with a fairly complex process to use the STR (sales tax revenue) data for the room rate data and TNS data for the other multipliers. There are other ways to set this up and there are a lot(Jackson’s emphasis) of mathematical problems with no easy solution. These include
–How to figure out how many tax payers report their taxes properly,
— How to estimate daily rates for weekly vacation rentals as compared with hotels,
— How many people stay in each rental unit, and
— How to come up with multipliers for counties with a small TNS sample size.
I won’t go into how we resolved these but if you want more detail I can provide that later. We’ve done the best we can with it and tried to reality check it.
Approach 3: Work Backwards from an Estimate of the Number of Rental Units in Each County
Our agency includes our state parks service and state welcome center staff with about 400 total employees. The parks service takes up the overwhelming majority of those jobs but our welcome center staff is around 60 people and they are spread across our state at 9 welcome centers.
Each year the welcome center staff do a statewide ‘audit’ of all the various accommodations they can find in the state: hotels, rental homes, condos, campgrounds, etc. They look on the internet and in the phone book as well as in our existing records. They call these accommodations businesses and ask them how many rental units they have, among other questions.
From this process we have a database that allows us to estimate the number of rental units for each county. I think we probably capture about 90% of them.
For this model, which again, is as close to mathematically correct as possible, we use the following multipliers:
— Estimated occupancy rate (3yr. avg),
— Percentage of room nights that are paid,
— Mean nights stayed by overnight visitors,
— Percentage of travel parties that are overnight, and
— Estimated household travel size.
— All of the same issues and disclaimers from model number two above apply to this approach.
Let’s just pause here for a minute, stand up and give appreciation to
Dudley Jackson, SCPRT director of research, statistician and eager student of estimated household travel size.
The five million figure for Greenville may be a ballpark figure, as Jackson says, but at least we know the GPS coordinate of the ballpark, thanks to his collating of various information sources.
Ok. Now that you’ve had a chance to stretch your legs, let’s continue…
….Into the Rabbit Hole…
(Jackson continues his explanation)
For Greenville County from approach #1, our estimate was about 2.5 million.
That number is itself an average of three years (2.3M, 2.7M and 2.5M). This seems a long way from five million so let me explain why.
In the TNS data, respondents can indicate where they went in the survey by choosing destinations from a drop down menu or by tying them in. Again fortunately we purchase the record level data and so for the destinations that are typed in, we assign them to a county.
However, unfortunately TNS populate the drop down menu with the choice “Greenville/Spartanburg”. As you can imagine this creates all kinds of confusion so we had to find a way to separate out which of those visitors went to Greenville and which went to Spartanburg counties.
Most of the destinations in the drop down menu have a similar problem. In any case, the starting number for Greenville/Spartanburg for the three years was 3.8M, 3.5M and 3.6M. I won’t go into the process, but we wound up allocating about 20-30% of those each year to Spartanburg County.
For Greenville County from approach #2, our estimate was 5.7 million.
We found that for many counties the estimates from the two models were larger than the estimate from the survey data but Greenville was one of only a couple where there was an enormous difference. I would expect the two models to yield larger numbers considering that survey respondents often don’t remember all their travel and either can’t or don’t report all their travel on a questionnaire.
For Greenville County from approach #3, our estimate was 6.8 million.
For both this approach (#3) and approach #2 above, Greenville is an outlier among the developed counties for having a short length of stay due to all the business travel, a high incidence of visiting friends and relatives due to the large population and a lot of day visitors. In the TNS survey data, business travel, trips to visit friends and relatives and day visitation are all going to be very under-represented due to the way the questionnaire is set up. So Greenville is a little bit of a problem child but for many counties the three estimates are relatively close together. Based on a lot of the checks we have in place I’m pretty sure our model is generating decent estimates.
If you’re wondering whatever happened to Mayor Van Quickenborne and the original question….
Van Quickenborne brought his town’s tourism official into the conversation — Gauthier Renard — and continued to press Jackson for more information.
A Belgian news article from the summer had listed Kortrijk as having just over 232,000 room nights the prior year, and Van Quickenborne asked and received Jackson’s guess for the number of room nights in Greenville — again, a squishy number.
Jackson’s answer — around 1 million.
“Now, it is clear,” Van Quickenborne wrote to his tourism official. “We have to quadruple our number. Gauthier, this is our challenge.”
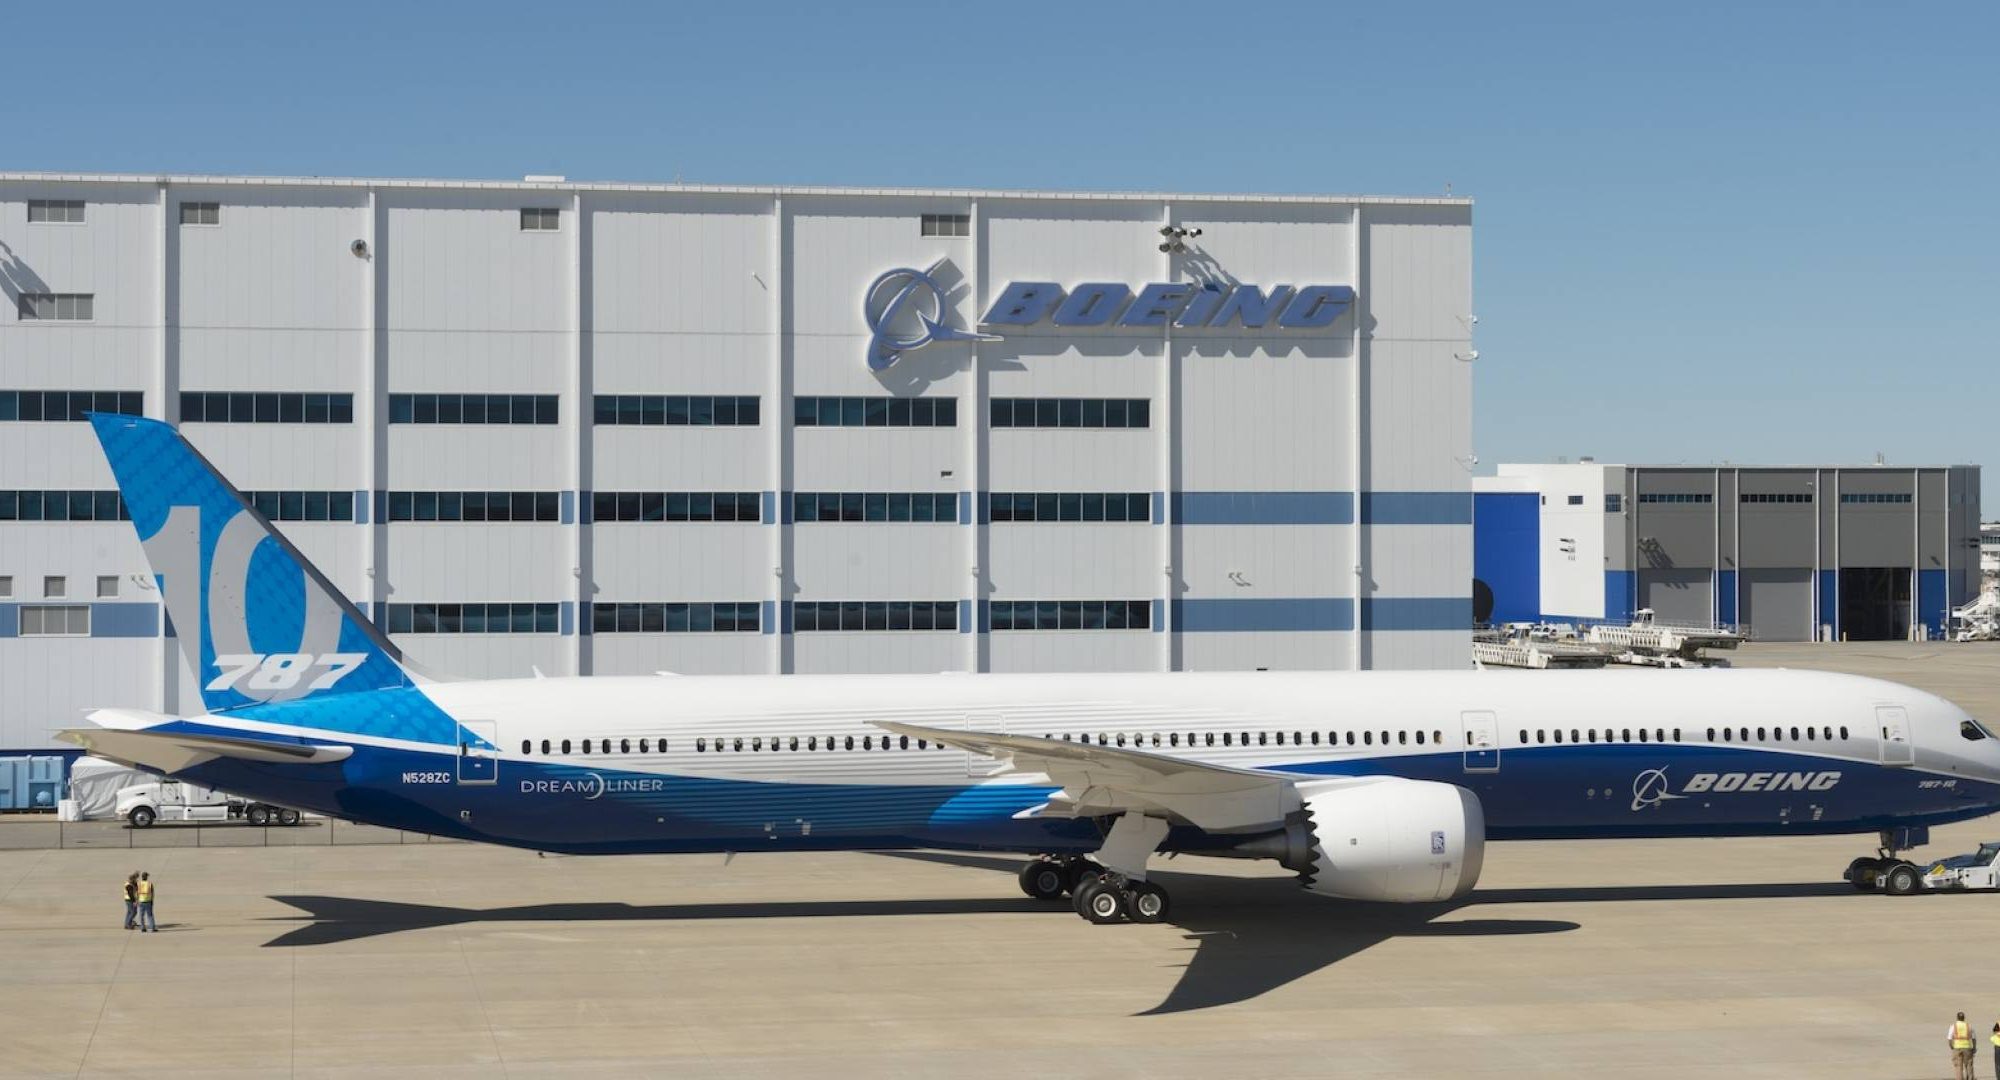
Emirates Airlines announced recently that it will buy 40 new Boeing 787-10 airplanes. Built exclusively at Boeing’s plant in Charleston, SC, the planes are valued at more than $15 billion.
“The Emirates deal brings the total order book for the 787-10 to 217 airplanes,” the Post and Courier reports. “Emirates also is the world’s largest Boeing 777 operator, with 165 in service.”
As 2016 drew to a close, the Upstate SC Alliance was reflecting on its growth, and considering how to build upon it in 2017.
For the past decade, the economic development group representing 10 counties and about 1.5 million people had averaged more than $1 billion in new foreign direct investment each year. Home to BMW’s largest manufacturing facility and the North American headquarters of Michelin, the Alliance and its leaders sought to attract new international companies.
Jacob Hickman, Business Development Manager, Upstate SC Alliance
“The idea was to focus on certain geographies where we haven’t spent a lot of time and energy in the past. We really wanted to invest in new markets and build new strong long-term relationships,” said Jacob Hickman, the Alliance’s director of business development.
For help, the Upstate SC Alliance turned to SC Connect.
“SC Connect is able to align the Upstate SC Alliance with potential new investment opportunities, through direct interaction with companies and industry associations,” Hickman said. “They truly understand the dynamics of the Belgium market and where the best synergies reside.”
In preparation for a summer trip by Alliance representatives, SC Connect focused on matching growing Belgian companies with the Upstate’s target sectors – advanced materials, aerospace, automotive, bioscience and energy.
At about the same time, AGORIA – Belgium’s largest employer and trade association – had created a new focus group on transport and mobility. Determined to be more than a network, the new group developed a strong mission-focused vision to increase business, particularly in the United States.
SC Connect met with the group’s leader, who was cautious at first. But over time, the group warmed to the idea and hosted a meeting between members of the group and the Upstate Alliance during the Belgian visit in June.
Building A Business Partnership
Gathering at the transport group’s modern offices in downtown Brussels, Hickman and Upstate representatives outlined the scope and depth of South Carolina’s automotive industry, and the opportunities for Belgian ingenuity.
Both groups left feeling that partnerships were possible.
Through the summer of 2017, the Upstate SC Alliance, AGORIA’s Transport and Mobility Club and SC Connect worked to connect the Belgian group to the South Carolina automotive sector.
As a result, Belgian industry representatives will travel to the SC Automotive Council’s annual conference in 2018 and present to state leaders on agile manufacturing, one of the group’s specialties.
“The success of that trip was first, getting a good understanding of the genetic makeup of Belgium,” says Hickman. “And, second, we’re going to have a delegation from the Belgian mobility sector coming in February, so Belgian companies will be interacting with South Carolina companies.”
“You’re not always going to get projects out of trips like that,” he said. “But now that there are boots on the ground in the form of SC Connect, there’s a connectivity that hasn’t been there before.”
At the beginning of 2017, Ward Vleegen had a short time to make a big impact.
As head of the newly created Transport and Mobility Group, he was charged with building a new division within the much larger AGORIA group – Belgium’s largest employer and trade association.
Ward Vleegen, head of Agoria’s Transport and Mobility Club in Belgium
Vleegen knew what he was doing – he’d been creating collaborations within the automotive industry for more than a decade, but his board and members were serious about building business – not simply joining another network.
The prospect of a U.S. trip was discussed almost from the time the group began in November of 2016.
“My steering committee asked for a very focused approach, and not just a general visit,” Vleegen said.
About the same time, the Upstate SC Alliance, home to BMW’s largest manufacturing and plant as well as the North American headquarters of Michelin, asked SC Connect to help it make inroads into Belgium.
BeneluxConnect reached out to Vleegen and his group. Cautious at first, Vleegen over time warmed to the idea and helped arrange a meeting with members of his group and the Upstate Alliance during their Belgian visit in June.
Gathering at the club’s modern offices in downtown Brussels, the Upstate representatives outlined the scope and depth of South Carolina’s automotive industry, and the opportunities for Belgian ingenuity.
Once that happened, “We could see that the (Belgian) companies that were present were interested in South Carolina,” Vleegen said. “And that, for us, meant ‘okay, we have to move this forward.’”
Through the summer of 2017, Vleegen, the Upstate SC Alliance and SC Connect worked to connect the Transport and Mobility Club to the South Carolina automotive sector.
As a result, members of the Belgian group traveled to the SC Automotive Council’s annual conference in 2018 and presented to state industry leaders on agile manufacturing, one of the group’s specialties. BeneluxConnect – through its sister company SCConnect – prepared an extensive online portfolio for the trip, which you can view here.
Vleegen knows he would have made the contacts within South Carolina sooner or later. But he credits SC Connect with speeding the process by making the personal connection.
“Meeting the people was definitely an added value,” he said. ‘That was a big added value.”


 Colleton County has an unnamed food packaging manufacturing plant interested in its 100,000 sq. ft. spec building, the Press and Standard newspaper of Walterboro reported on Walterborolive.com.
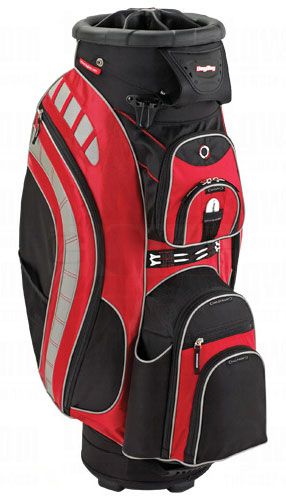
 A Virginia-based golf and accessory company is moving its manufacturing and warehouse operations to Chesterfield County in South Carolina,
 Swiss-based biopharma company Lonza will invest $46 million over five years in its Greenwood County plant, creating 30 new jobs, the state of South Carolina announced.


 Our agency includes our state parks service and state welcome center staff with about 400 total employees. The parks service takes up the overwhelming majority of those jobs but our welcome center staff is around 60 people and they are spread across our state at 9 welcome centers.